
Mapping Sanitation Vulnerability in Jordan
Where should sanitation investment go first? This research translated that question into a spatial decision-support framework by combining infrastructure, population, groundwater, land, rainfall, and other vulnerability indicators across Jordan.
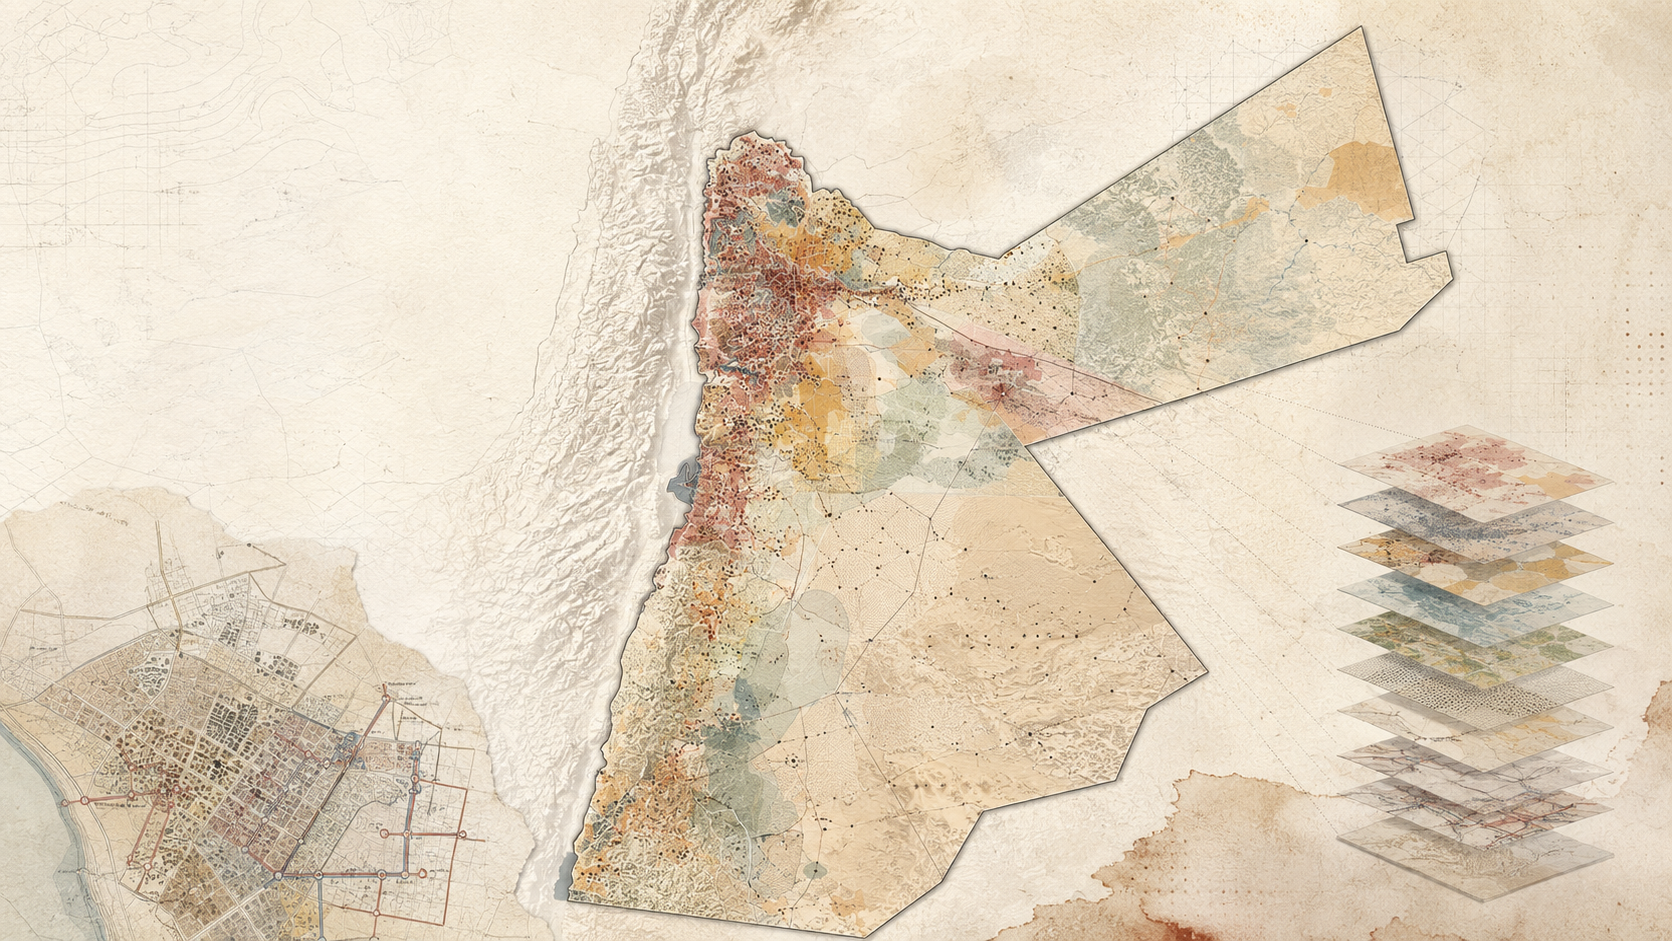
This research developed a GIS-based Sanitation Hotspot Index for Jordan to identify districts and neighborhoods with the greatest need for sanitation intervention. Using the Analytic Hierarchy Process, expert and stakeholder input, and multiple spatial datasets, the study combined ten criteria into a national vulnerability model. The resulting maps were designed to support sanitation planning, funding allocation, donor prioritization, and infrastructure investment.
- Written by
- mbtalafha
- Reading time
- 6 min read
Why this matters
This research developed a GIS-based Sanitation Hotspot Index for Jordan to identify districts and neighborhoods with the greatest need for sanitation intervention. Using the Analytic Hierarchy Process, expert and stakeholder input, and multiple spatial datasets, the study combined ten criteria into a national vulnerability model. The resulting maps were designed to support sanitation planning, funding allocation, donor prioritization, and infrastructure investment.
From sanitation gaps to spatial priorities
Sanitation planning is not only a question of where sewer networks are absent. The urgency of intervention also depends on population, groundwater vulnerability, land use, nearby water resources, existing treatment infrastructure, and other environmental and spatial conditions.
This research asked a practical planning question: how can these different forms of vulnerability be brought together into one spatial framework that helps identify where sanitation intervention should be prioritized?
The study developed a Sanitation Hotspot Index for Jordan using Geographic Information Systems and the Analytic Hierarchy Process. The aim was not simply to map existing infrastructure, but to build a decision-support tool capable of comparing sanitation need across the country at both district and neighborhood scales.
Building the spatial evidence base
The research assembled datasets from multiple ministries, agencies, and other data providers into a unified GIS geodatabase. The data covered topography, demographics, meteorology, infrastructure, land use and land cover, groundwater, water resources, sanitation services, and wastewater treatment infrastructure.
Because these datasets came from different sources, formats, projections, and spatial standards, a significant part of the work involved organizing them into a common spatial framework before analysis could begin.
This step is easy to overlook, but it is fundamental to spatial decision-making. A vulnerability model is only as useful as the consistency, comparability, and spatial logic of the data beneath it.
Ten indicators, one sanitation question
The study evaluated ten criteria associated with sanitation vulnerability: existing sanitation services, population density, depth to groundwater, land use and land cover, precipitation, distance to springs, distance to water reservoirs, density of groundwater wells, soil hydraulic conductivity, and distance to wastewater treatment plants.
These indicators connect sanitation provision with both human need and environmental risk. Population density captures the concentration of people requiring service. Existing sanitation identifies where service gaps remain. Groundwater depth, wells, springs, reservoirs, soil conditions, and rainfall introduce questions of environmental vulnerability and contamination risk. Distance to treatment plants adds an infrastructural dimension to prioritization.
The resulting framework therefore treated sanitation need as multidimensional rather than as a single infrastructure variable.
Using expert judgment without hiding the weighting process
A central challenge in multi-criteria analysis is deciding how much each indicator should matter. The research used the Analytic Hierarchy Process to assign relative weights through structured pairwise comparison.
Experts and stakeholders from academia, the private sector, NGOs, ministries, water and sanitation authorities, and municipalities contributed to the prioritization process. Their judgments were translated into relative weights and then tested for consistency.
Population density received the highest relative weight, followed by existing sanitation and depth to groundwater. Soil hydraulic conductivity received the lowest weight. The calculated consistency ratio was 0.0619, below the commonly accepted AHP threshold of 0.1, indicating that the weighting process was internally consistent.
Turning indicators into a Sanitation Hotspot Index
Each criterion was converted into a spatial indicator layer and normalized according to its assigned weight. GIS tools were then used to combine the weighted layers into a composite Sanitation Hotspot Index.
The model was refined to account for existing sanitation coverage so that areas already fully or partially served would not be represented as equally vulnerable to areas without sanitation networks.
This produced a final spatial index capable of distinguishing different levels of sanitation vulnerability across Jordan.
The scale of analysis changes what becomes visible
The research produced vulnerability maps at both district and neighborhood scales.
At the district scale, the model reveals national and regional patterns useful for broad investment and policy discussions. At the neighborhood scale, the same framework becomes much more operational, exposing local differences that can disappear within large administrative units.
This distinction is important for planners. A district classified as vulnerable is not internally uniform. Neighborhood-scale mapping makes it possible to move from a national prioritization framework toward more targeted sanitation interventions.
Where vulnerability concentrated
The final results classified districts and neighborhoods into five vulnerability categories. Areas with the greatest need for sanitation solutions were concentrated largely in the northwestern part of Jordan, with additional vulnerable locations elsewhere in the country.
The study found that high vulnerability was strongly associated with high population density and limited sanitation coverage. The final maps also incorporated environmental and infrastructural indicators so that prioritization was not based on population alone.
At the district level, highly vulnerable areas included districts across Irbid, Mafraq, Ajlun, Jarash, Al Balqa, Zarqa, Amman, Madaba, Karak, Tafileh, Ma'an, and Aqaba, with substantial variation among governorates.
From research output to planning tool
The significance of the work extended beyond publication. The Sanitation Hotspot Index maps and GIS geodatabase were officially handed over to the Water Authority of Jordan and the Ministry of Water and Irrigation.
The research describes the geodatabase as supporting the establishment of sanitation GIS capacity within the Water Authority of Jordan, alongside planned training and updating of the database.
This is an important distinction. The project was not only an academic exercise in spatial modelling. It was developed as a practical decision-support framework intended to help government agencies, planners, donors, and other stakeholders direct sanitation investment toward areas of greatest need.
What the research contributes
A national GIS framework for comparing sanitation vulnerability across Jordan A multi-criteria model linking infrastructure gaps with demographic and environmental vulnerability A transparent AHP weighting process informed by experts and stakeholders District-scale and neighborhood-scale sanitation hotspot maps A spatial decision-support tool for prioritizing sanitation investment and donor funding A geodatabase designed for continued institutional use rather than a one-time academic map
A national GIS framework for comparing sanitation vulnerability across Jordan
A multi-criteria model linking infrastructure gaps with demographic and environmental vulnerability
A transparent AHP weighting process informed by experts and stakeholders
District-scale and neighborhood-scale sanitation hotspot maps
A spatial decision-support tool for prioritizing sanitation investment and donor funding
A geodatabase designed for continued institutional use rather than a one-time academic map
From knowledge to action
Practical applications
Use vulnerability mapping to prioritize sanitation investments where service gaps coincide with high population and environmental risk.
Combine infrastructure data with demographic, groundwater, land-use, and water-resource indicators rather than mapping service coverage alone.
Use neighborhood-scale analysis to reveal local vulnerability hidden within district or governorate averages.
Apply multi-criteria decision analysis when sanitation investment depends on several competing technical, social, and environmental priorities.
Document weighting assumptions explicitly so decision-makers can understand how spatial priorities were produced.
Maintain vulnerability models as updateable GIS systems rather than static final maps.
Use hotspot mapping to support dialogue among government agencies, municipalities, donors, utilities, and infrastructure planners.
Connect sanitation prioritization with groundwater protection and wider water-resource planning.
Carry into the field
Questions for planners
Which indicators should determine where sanitation investment is most urgent?
Are infrastructure gaps being considered alongside environmental and demographic vulnerability?
How sensitive are planning priorities to the weights assigned to different criteria?
What changes when sanitation vulnerability is mapped at neighborhood rather than district scale?
Can the underlying geodatabase be updated as infrastructure, population, or environmental conditions change?
How can spatial prioritization make funding and investment decisions more transparent?
Which communities remain invisible when planning relies only on existing sewer-network maps?
How should expert judgment, institutional priorities, and spatial evidence be balanced in infrastructure planning?
References
Sources for continued reading.
- 01Source ↗
Hammouri, N., Talafha, M., Hamarneh, Q., Annab, Z., Al-Ruzouq, R., and Shanableh, A. 2022. Vulnerability Hotspots Mapping for Enhancing Sanitation Services Provision: A Case Study of Jordan. Water, 14, 1689.
Connected Knowledge
Continue through the relationships surrounding this record.
Follow what this record touches next.
Cities
Cities are shaped by institutions, infrastructure, markets, households, conflict, care, and everyday negotiation.
Continue →